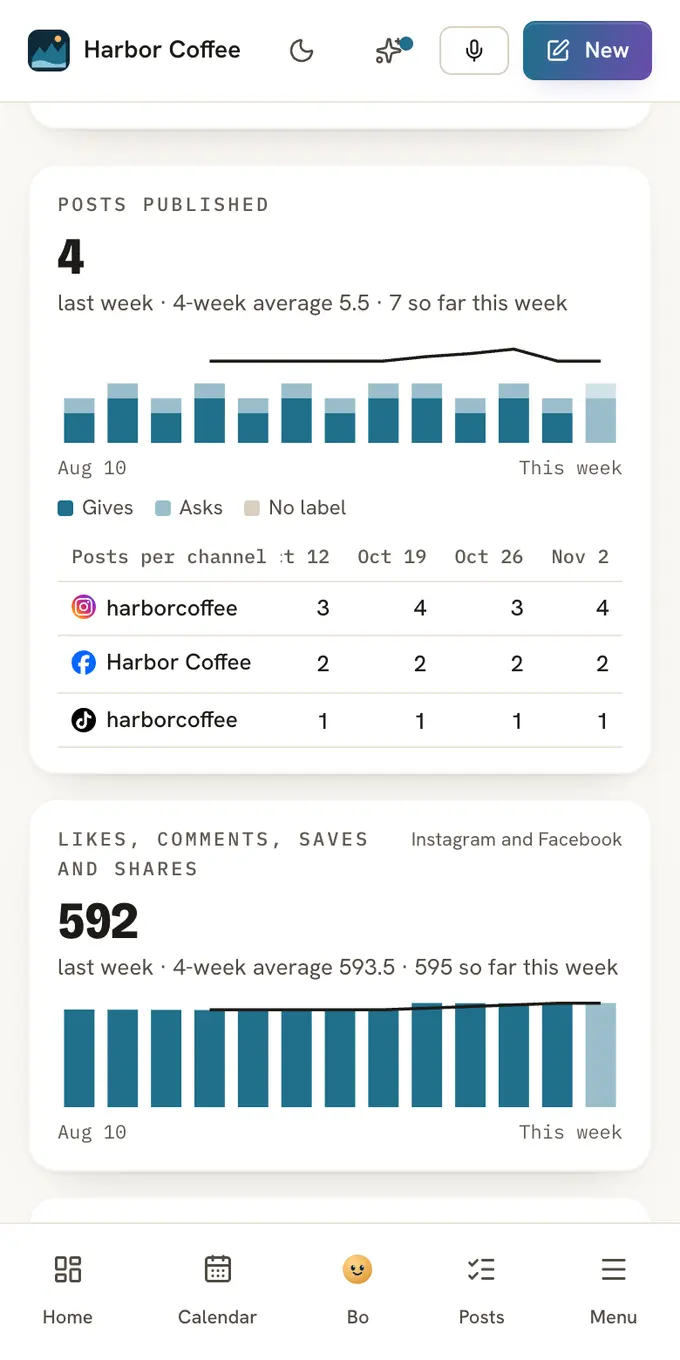
Most people who see a post never click it. They save it, send it to a friend, visit your profile or send you a DM a few days later. Postfjord reads the numbers from your accounts every night and counts those things too, so you can see what your posts did and what to post next.
- 12weeks side by side, from posts published to new DM conversations and email subscribers
- 2xyour usual reach or likes and comments, and the post shows up on your Home
- 20of your earlier posts on the same account set what counts as usual
Last week in one sentence
Week by week opens with last week in plain words, for example: "Last week: 4 posts, 31 likes, comments, saves and shares, 6 new DM conversations and 3 new subscribers. 2 people said they found you through Instagram."
One small chart per number, on the same weeks
- Posts published, split into posts that give and posts that ask.
- Likes, comments, saves and shares, Profile visits, New followers and People reached, from Instagram and Facebook.
- New DM conversations: people who wrote to you first that week.
- New email subscribers and Said where they found you, from your signup forms.
- Landing page views, Landing page taps and Link clicks in DMs.
Each chart has a line for the 4-week average, so one odd week does not fool you. After 8 weeks, Posting and what followed says whether the weeks you posted more were also the weeks more people signed up, wrote to you or followed you. Tap a week under Notes on weeks to add "Opened the spring class", and the note shows on every chart.
All channels, added up
Pick 7, 30, 90 or 365 days. The top of Channels adds up every account for those days, with an arrow that compares them to the same number of days before.
- Followers: all of them together, and how many you won or lost.
- Engagement rate: likes and comments per post out of every 100 followers. 2% means 2 for every 100.
- Reach per day: how many people saw your posts on an average day.
- Your five best posts across every channel, and a table with the channels side by side.
A channel you connected last week does not look like growth: only channels with numbers for both periods count, on both sides. Pick one under Each channel for its followers over time, when its followers are online, and likes and comments by weekday, hour, topic and kind of post.
A post that did better than usual
- The post goes out: Through Postfjord, on Instagram or Facebook
- Postfjord compares it: Every night, with the 20 posts before it on that account
- Twice the usual: It reached 4,200 people. Your posts usually reach 1,100.
- Add your link: One press puts your call to action in a comment under it
The post shows on Home under Needs attention for 7 days, and as a green line under Posts in the Calendar. A post also needs at least 500 people reached, 30 likes and comments or 10 comments, so a post that went from 2 likes to 5 stays quiet. Add your link never runs by itself, and each post gets one comment at most.
Best times and topics
Best times to post shows when your posts got the most likes and comments, in your workspace's time zone. Each channel is measured against its own usual, so a big Instagram account does not decide the times for a small Facebook Page. A time shows once you have posted at it at least twice.
Every post is also sorted into a topic: educational, offer, event or class, behind the scenes, community, inspiration or other. Each channel then says what stands out, for example that educational posts at a salon get twice the likes and comments of offers.
Post your best again
Your best content to repost lists your posts with the most likes and comments in the last 90 days.
Pick a post
Find it under Week by week, best first.
Press Redraft
Bo writes a fresh version: the same idea, with a new first line and new words.
Check and schedule
It opens in the composer as a draft. Add a picture, change what you want, then schedule it.
Watch other accounts
Add a public Instagram business or creator account under Watch: a studio across town, a brand you look up to. You see its followers and its 12 latest posts with likes and comments. The account is not told.
Breakouts picks out their posts that got at least 3 times their usual likes and comments. Press Make my version and Bo writes a draft for your Instagram on the same idea, in your own words. Bo never copies the post and never names the other account.
Do ChatGPT and Claude name you?
More people ask an AI app where to go instead of searching. AI answers checks it once a month.
Write the questions
The ones a new customer would ask, without your name: "best yoga studio in Austin". Suggest questions gives ideas.
Postfjord asks each month
ChatGPT and Claude, with web search on. Press Check now to see today's answers.
Read the answers
Named you or Did not name you, the sites each answer used, and a dot per month.
Answers change from one ask to the next, so look at the months together. Free keeps 1 question, Solo 5, Studio 10 and Agency 20.
A report for the client
Pick a month and press PDF report. It carries your logo and, with agency branding on, "Prepared by" and your agency's logo. Inside: posts per channel, followers and reach per account, the best posts, the week by week numbers with your notes, and bookings and sales when a booking system or Stripe is connected. Press Email me each month and the report for the month before arrives early each month.
What each platform shares
- Instagram: followers, posts, likes, comments, reach, profile views and when your followers are online.
- Facebook: followers, posts, likes, comments and reach.
- Pinterest: followers and monthly views.
- Threads, LinkedIn, TikTok and X: the posts Postfjord published. These platforms do not share their numbers with Postfjord yet.
Read on
FAQ
Where do the numbers come from?
Posts, DM conversations, email signups, landing page visits and link clicks are Postfjord's own records. Likes, comments, saves, shares, profile visits, followers and reach come from Instagram and Facebook through Meta.
When do the numbers update?
Every night. Press Refresh on Channels to fetch them now, or Count now on Week by week to count this week right away.
How far back does the history go?
From the day you connect the channel. The Free plan shows the last 3 months, Solo and Studio the full year. Numbers keep being collected on every plan, so an upgrade shows the older ones right away.
Why do you not show ROI?
A person may see five of your posts, hear about you from a friend and sign up a month later. A single number that says "your posts made $X" would be a guess. Postfjord shows the counts side by side, week by week, and says in words when two of them rise together.
Can I export a report?
Yes. PDF report makes a PDF of any month your plan's history covers, up to a year back. You can also connect an AI app such as ChatGPT or Claude, which reads the same numbers on Solo or bigger.
Does analytics cost anything?
The numbers are included on every plan. Sorting posts into topics uses a fraction of a cent per new post from your AI budget, and each AI answers question costs about 5 to 15 cents a month.